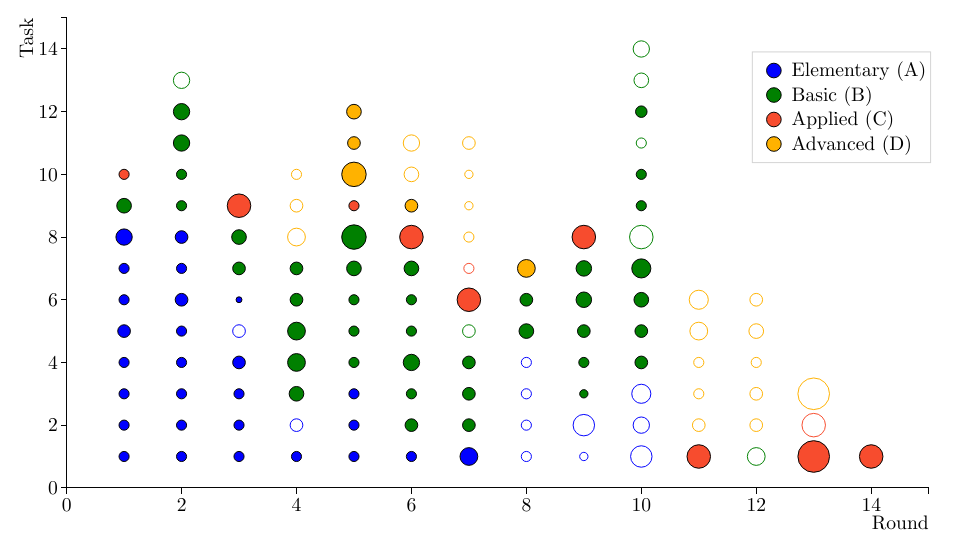
Criterion-based grading, agile goals, and course (un)completion strategies: a visualization of a student’s learning path on TUT Programming 1 course. The Y-axis shows different automatically assessed programming tasks and the X-axisshows the rounds of the course (mapping to weeks on a semester). Colored balls are completed (the student’s solution passed the tests). Different colors represent different categories/levels of the tasks.
While working on a book chapter called Criterion-based grading, agile goals, and course (un)completion strategies (with Ihantola, Isohanni & Mikkonen) for a new Springer book that concentrates on agile learning strategies etc. we needed to generate lots of visualizations. The visualizations were supposed to show the completion paths of different students for the first programming course at Tampere University of Technology.
I took on the task and chose Python for scripting to digest all the data and transform it to a suitable format, D3.js for generating the actual visualizations, and Puppeteer to handle the generation and PNG saving of ~1000 visualizations.
The visualizations turned out pretty nice and the workflow was good. After nailing down the Python data digestion and what we even wanted from it, I played a ton with D3 and came up with a nice looking visualization. After we all agreed on how the thing should look like I used a simple Puppeteer script to turn everything into a nice directory hierarchy of lots of PNGs. I was happy that each of the steps were self-contained and didn’t depend on any of the other steps. My initial data was in CSV format and I used Python to go through it and dig out the needed bits and pieces. I made a simple visualization.html that contained all HTML, CSS, and JavaScript to display a single visualization, nothing more. I ran Python’s SimpleHTTPServer to serve the page on my localhost and to play with it until it looked nice. In the end I had a very simple Node.JS script that started Puppeteer which uses Headless Chrome browser in the background to do all sorts of webpage manipulation; Puppeteer went over every student’s data and loaded the visualization.html for all of them and turned to page into a PNG file.
I could have gone for all Python solution but I hadn’t had any reason to use Puppeteer before so this was a nice thing to tryout. Also, I had some experience from D3.js so it was much easier to come up with the visualization code using the library and the web instead of some Python plotting library or whatnot. We were happy with the results.

how did you wait for puppeteer to finish loading all the js and executing and and drawing the various charts before printing the png.
I used
page.waitForSelector(). With thewaitForSelectormethod you may tell the page object to suspend execution until an element is visible. So basically if you render an SVG with an id “result”, you could just sayawait page.waitForSelector('#result')and after it resumes, the rendered result may be caught via screenshot or whatever.You may find more about the
waitForSelectorAPI here: https://github.com/GoogleChrome/puppeteer/blob/master/docs/api.md#pagewaitforselectorselector-options